

Population and demographics
This paper gives an overview of the population of Edinburgh, both current and projected. The data are taken from a number of sources, most of which were
published during 2025. No consideration has been made for the effect of COVID-19 on the population, however, this will become apparent in future updates to NRS estimates and projections.
There are seven sections in this chapter considering:
- Population estimates for the City of Edinburgh and its localities.
- Ethnicity.
- Country of birth and nationality.
- Population projections, to 2034, again for the City and its localities.
- Migration trends.
- An overview of deprivation data.
- Household estimates and projections for the City.
Detailed key points are highlighted at the end of each section, however, as a summary, a number are noted here:
- The National Records of Scotland (NRS) mid‑2024 population estimate places Edinburgh’s population at 530,680.
- In common with other Scottish cities, the mid-2024 population estimate showed a slight increase for Edinburgh, from the mid-year population estimate for 2023, from 523,250 to 530,680.
- This increase was primarily in the 0-17 and 18-44 age groups, with those age groups accounting for 74.2% of the difference between the 2023 and 2024 figures.
- The most common moves within Scotland were from the largest cities, Glasgow and Edinburgh especially, to their neighbouring council areas
- North West is the largest locality accounting for 28.5% of the population of Edinburgh
- The overall population of Edinburgh is expected to grow by 10.5% between 2022 and 2034.
- Each of the older population age groups in Edinburgh and Scotland are expected to grow by at least a fifth
- The largest growth is expected in the North East locality
- Just over 2 in 5 people (43.5%) in Edinburgh live in the 20% least deprived areas of Scotland
- Over half of the population in both North West and South East live in the 20% least deprived datazones in Scotland
- North East has the highest proportion living in the most deprived datazones
- Two fifths of households in Edinburgh are single person households.
Comparisons against the national data are also included where appropriate.
Population estimates:
- The data source was drawn from the latest NRS Mid-2024 population estimates instead of the Mid 2022 estimates used in the previous version.
- The population of Edinburgh is estimated to have grown from 514,990 to 530,680
Population estimates for localities:
- The data source was updated from the NRS Mid-2022 Small Area Population Estimates for 2011 Data Zones to the latest data from Mid-2024.
- Figures have remained consistent from the previous version
Population projections:
- The data was drawn from the latest 2022-based NRS population projections instead of the 2018-based projections used in the previous version.
- Years covered in this version are from 2022-2034 compared with 2018-2030 in the previous version
- The age group showing the largest increase is 85+ age group while in the previous version 75-84 showed the largest increase in population
- The 18-44 age group has an increase larger than the overall while in the previous version all age groups below 65 had an increase less than the overall
- Overall population in Edinburgh is projected to grow 10.5% between 2022-2034, compared to the 7.7% growth projected for 2018-2030 in the previous version
- The percentage in population for Males in the 65+ (25.1%) and 90+ (39.2%) age groups are much lower than the projections from the previous version which was 31% and 58.7%
Migration:
- The data has been updated to the latest migration figures from Mid-2024
- Net migration from the rest UK, Overseas and Total Net migration to Edinburgh all decreased from the 2022 figures
- On the other hand, Net migration from the rest UK, Overseas and Total Net migration to Scotland all increased from the 2022 figures.
Households:
- Estimated households increased from 238,269 to 244,791, dwellings also increased from 252,731 to 266,309, while number of second homes, vacant homes and long-term empty homes all fell in Edinburgh compared to the previous version.
- Data source has been updated to the latest 2024 Household and Dwellings publication from the NRS. Projections are now 2022-based (covering 2022-2034) instead of the 2018-based projections from previous version.
Data in this section are drawn from the National Records of Scotland (NRS) Mid-2024 Population Estimates[i], the latest available data.
Table 1.1: Estimated population of Edinburgh, mid-2024
| Male | Female | Total | |
| 0-17 | 44,343 | 41,890 | 86,233 |
| 18-44 | 112,978 | 125,212 | 238,190 |
| 45-64 | 59,676 | 61,399 | 121,075 |
| 65-74 | 21,330 | 23,395 | 44,725 |
| 75-84 | 12,682 | 16,105 | 28,787 |
| 85+ | 4,313 | 7,357 | 11,670 |
| Total | 255,322 | 275,358 | 530,680 |
Key points include:
- The population of Edinburgh in mid-2024 was estimated to be 530,680.
- 51.9% of the population are female.
- 16.2% of the population are under 18.
- 16.1% of the population are 65+.
- 2.2% of the population are 85+.
[i] Mid-2024 Population Estimates Scotland, National Records of Scotland https://www.nrscotland.gov.uk/publications/mid-2024-population-estimates/ (14 August 2025)
As required in the Public Bodies (Joint Working) (Scotland) Act 2014, the legislation underpinning the integration of Health and Social Care, the Integration Joint Board is required to prepare a strategic plan that divides the area it covers into at least two localities.
The locality boundaries for the Edinburgh Health and Social Care Partnership can be found as a layer within the Health section of the City of Edinburgh Council’s Atlas. The boundaries for the Health and Social Care Partnership are coterminous with the City of Edinburgh Council locality boundaries.
The NRS Mid-2024 Small Area Population Estimates for 2011 Data Zones[i] allow the population in each locality to be estimated. The tables below show the population split by locality and age group; first the population and secondly the distribution of the age groups across the population in each locality. North West and South East remains the largest localities in Edinburgh since mid-2019 estimates. The population percentage has increased in North East Edinburgh whilst South West has decreased, so South West population is now smaller than North East.
Table 1.2: Estimated population of localities in Edinburgh, mid-2024
| North East | North West | South East | South West | Total | |
| 0-17 | 18,531 | 29,275 | 19,036 | 19,391 | 86,233 |
| 18-44 | 62,129 | 53,098 | 70,552 | 52,411 | 238,190 |
| 45-64 | 28,370 | 38,494 | 27,943 | 26,268 | 121,075 |
| 65-74 | 9,281 | 14,448 | 11,165 | 9,831 | 44,725 |
| 75-84 | 5,588 | 9,503 | 7,121 | 6,575 | 28,787 |
| 85+ | 2,202 | 4,073 | 2,897 | 2,498 | 11,670 |
| Total | 126,101 | 148,891 | 138,714 | 116,974 | 530,680 |
| Of Edinburgh population | 23.8% | 28.1% | 26.1% | 22.0% | 100.0% |
Table 1.3: Percentage of population by age group in localities, Edinburgh and Scotland, mid-2024
| North East | North West | South East | South West | Total | Scotland | |
| 0-17 | 14.7% | 19.7% | 13.7% | 16.6% | 16.2% | 18.4% |
| 18-44 | 49.3% | 35.7% | 50.9% | 44.8% | 44.9% | 34.5% |
| 45-64 | 22.5% | 25.9% | 20.1% | 22.5% | 22.8% | 26.6% |
| 65-74 | 7.4% | 9.7% | 8.0% | 8.4% | 8.4% | 11.0% |
| 75-84 | 4.4% | 6.4% | 5.1% | 5.6% | 5.4% | 7.1% |
| 85+ | 1.7% | 2.7% | 2.1% | 2.1% | 2.2% | 2.4% |
| Total | 100.0% | 100.0% | 100.0% | 100.0% | 100.0% | 100.0% |
Key points include:
- North West is the largest locality accounting for 28.1% of the population of Edinburgh
- South West is the smallest locality accounting for 22% of the population of Edinburgh
- North East is the locality with the lowest number of older people in Edinburgh, with its 65+ population accounting for 13.5% of the general population
- North West has the highest proportions of population in every age group except the 18-44 age group
- South East has the highest proportion of people aged 18-44 at 50.9%
[i] The NRS Mid-2024 Small Area Population Estimates for 2011 Data Zones https://www.nrscotland.gov.uk/publications/small-area-population-estimates-mid-2023-and-mid-2024-2011-data-zones/ (24 February 2026)
The NRS 2022 Census results[i] remain the main source of data on ethnicity of the Scottish population. The overall number of people in Edinburgh who are white has increased by less than 500 people. With the increase of other ethnic groups the % of white population has decreased by 7% since 2011. This is also seen in Scotland as a whole with a 4% decrease in white population. From 2011 to 2022, there has been an increase in Asian, Asian Scottish or Asian British from around 26k to 44k people. In 2011 this ethnic group was 5.5% of Edinburgh population, whilst in 2022 it is now 8.6%. The increase is also seen across Scotland, though the difference is not as big (from 2.7% to 3.9%).
Table 1.4: Ethnicity 2022, Edinburgh
| 0 – 15 | 16 – 24 | 25 – 34 | 35 – 49 | 50 – 64 | 65 and over | All people | |
| White: Total | 57,325 | 58,772 | 72,358 | 85,079 | 83,836 | 79,368 | 436,742 |
| White: Scottish | 44,410 | 34,527 | 40,156 | 49,786 | 64,035 | 65,621 | 298,533 |
| White: Other British | 5,715 | 13,188 | 13,096 | 14,472 | 12,769 | 10,589 | 69,829 |
| White: Irish | 474 | 1,977 | 2,527 | 2,626 | 1,635 | 1,091 | 10,326 |
| White: Gypsy/Traveller | 33 | 49 | 49 | 60 | 44 | 19 | 256 |
| White: Polish | 3,030 | 1,672 | 3,335 | 6,607 | 1,301 | 404 | 16,351 |
| White: Other White | 3,663 | 7,361 | 13,198 | 11,527 | 4,054 | 1,650 | 41,449 |
| Mixed or multiple ethnic groups | 4,477 | 2,835 | 2,392 | 2,094 | 778 | 303 | 12,882 |
| Asian, Asian Scottish or Asian British | 8,184 | 11,658 | 8,446 | 10,204 | 4,020 | 1,558 | 44,070 |
| African | 2,749 | 1,184 | 1,722 | 2,715 | 908 | 182 | 9,462 |
| Caribbean or Black | 228 | 229 | 311 | 375 | 208 | 64 | 1,419 |
| Other ethnic groups | 2,055 | 1,621 | 2,227 | 2,536 | 1,045 | 486 | 9,966 |
| All people | 75,019 | 76,305 | 87,454 | 103,006 | 90,797 | 81,962 | 514,543 |
Table 1.5: Ethnicity 2022, Edinburgh
| 0 – 15 | 16 – 24 | 25 – 34 | 35 – 49 | 50 – 64 | 65 and over | All people | |
| White: Total | 76.4% | 77.0% | 82.7% | 82.6% | 92.3% | 96.8% | 84.9% |
| White: Scottish | 59.2% | 45.2% | 45.9% | 48.3% | 70.5% | 80.1% | 58.0% |
| White: Other British | 7.6% | 17.3% | 15.0% | 14.0% | 14.1% | 12.9% | 13.6% |
| White: Irish | 0.6% | 2.6% | 2.9% | 2.5% | 1.8% | 1.3% | 2.0% |
| White: Gypsy/Traveller | 0.0% | 0.1% | 0.1% | 0.1% | 0.0% | 0.0% | 0.0% |
| White: Polish | 4.0% | 2.2% | 3.8% | 6.4% | 1.4% | 0.5% | 3.2% |
| White: Other White | 4.9% | 9.6% | 15.1% | 11.2% | 4.5% | 2.0% | 8.1% |
| Mixed or multiple ethnic groups | 6.0% | 3.7% | 2.7% | 2.0% | 0.9% | 0.4% | 2.5% |
| Asian, Asian Scottish or Asian British | 10.9% | 15.3% | 9.7% | 9.9% | 4.4% | 1.9% | 8.6% |
| African | 3.7% | 1.6% | 2.0% | 2.6% | 1.0% | 0.2% | 1.8% |
| Caribbean or Black | 0.3% | 0.3% | 0.4% | 0.4% | 0.2% | 0.1% | 0.3% |
| Other ethnic groups | 2.7% | 2.1% | 2.5% | 2.5% | 1.2% | 0.6% | 1.9% |
| All people | 100% | 100% | 100% | 100% | 100% | 100% | 100% |
Table 1.6: Ethnicity 2011, Scotland
| 0 – 15 | 16 – 24 | 25 – 34 | 35 – 49 | 50 – 64 | 65 and over | All people | |
| White: Total | 88.2% | 88.8% | 90.2% | 90.9% | 96.5% | 98.5% | 92.9% |
| White: Scottish | 78.5% | 72.8% | 71.9% | 71.6% | 81.6% | 84.9% | 77.7% |
| White: Other British | 5.0% | 8.7% | 8.8% | 9.8% | 11.2% | 11.3% | 9.4% |
| White: Irish | 0.3% | 1.2% | 1.3% | 1.3% | 1.1% | 1.1% | 1.0% |
| White: Gypsy/Traveller | 0.1% | 0.1% | 0.1% | 0.1% | 0.1% | 0.0% | 0.1% |
| White: Polish | 2.2% | 1.6% | 2.4% | 3.4% | 0.7% | 0.2% | 1.7% |
| White: Other White | 2.1% | 4.4% | 5.7% | 4.7% | 1.9% | 0.9% | 3.0% |
| Mixed or multiple ethnic groups | 2.8% | 2.0% | 1.3% | 0.9% | 0.4% | 0.2% | 1.1% |
| Asian, Asian Scottish or Asian British | 5.5% | 6.6% | 5.4% | 5.2% | 2.1% | 1.0% | 3.9% |
| African | 2.1% | 1.2% | 1.5% | 1.7% | 0.4% | 0.1% | 1.1% |
| Caribbean or Black | 0.1% | 0.2% | 0.2% | 0.2% | 0.1% | 0.0% | 0.1% |
| Other ethnic groups | 1.3% | 1.2% | 1.4% | 1.3% | 0.5% | 0.2% | 0.9% |
| All people | 100% | 100% | 100% | 100% | 100% | 100% | 100% |
Key points from the 2022 census include:
- 84.9% of the population of Edinburgh (436,742 out of 514,543 people) were white
- The percentage of the population that is white in Edinburgh increases by age group from 76.4% for under 18 to 96.8% for 65 and over; 84.9% overall. In Scotland it increases from 88.2% to 98.5%; 92.9% overall
- In both Edinburgh and Scotland there are very small numbers of Caribbean or Black groups, not exceeding 0.5% in any age group.
- In both Edinburgh and Scotland there were very small numbers of people aged 65 and over who are not of white descent, less than 4% of Edinburgh population is non-white and over 65, whilst Scotland is less than 2%.
- Edinburgh has twice the national proportion of people who are Asian.
[i] Scotland’s Census 2022 – Ethnic group, national identity, language and religion https://www.scotlandscensus.gov.uk/2022-results/scotland-s-census-2022-ethnic-group-national-identity-language-and-religion/ (21 May 2024)
The Annual Population Survey provides estimate of the Scottish population by both nationality and country of birth. The results are published in the NRS Population by Country of Birth and Nationality, Scotland, July 2019 to June 2020[i] publication. Information is provided on the number of non-British nationals and non-UK born living in each local authority area in Scotland.
The table below shows the percentage of the population of the country of birth and nationality of people living in Edinburgh and Scotland.
Table 1.7: Country of birth and nationality, 2019-20
| Birth | Nationality | |||
|---|---|---|---|---|
| Edinburgh | Scotland | Edinburgh | Scotland | |
| UK | 78.8% | 90.1% | 81.9% | 92.3% |
| EU (Total) | 9.2% | 4.4% | 9.4% | 4.3% |
| EU 14 | 4.3% | 1.9% | 4.1% | 1.6% |
| EU 8 | 4.1% | 2.1% | 4.7% | 2.4% |
| EU 2 | 0.6% | 0.3% | 0.4% | 0.2% |
| EU other | 0.1% | 0.4% | 0.1% | |
| Other Europe | 0.6% | 0.3% | 0.1% | |
| Asia | 5.3% | 2.6% | 4.3% | 1.5% |
| Rest of World | 6.2% | 2.5% | 4.1% | 1.7% |
Due to low numbers, the number of people born in other EU countries and nationals of other European countries in Edinburgh were not published.
Key points include:
- The proportion of people living in Edinburgh who are born in UK or British nationals is at least twice the Scottish proportion in each category (where data are published).
- Over one in five people living in Edinburgh were not born in the UK and just under one in five are not British nationals.
- Nationally around one in ten were not born in the UK and are not British nationals.
[i] Population by Country of Birth and Nationality, Scotland, July 2019 to June 2020, National Records of Scotland, https://www.nrscotland.gov.uk/statistics-and-data/statistics/statistics-by-theme/population/population-estimates/population-by-country-of-birth-and-nationality/jul-19-jun-20 (14 January 2021)
The latest population projections are based on the NRS Subnational Population Projections: 2022-based[1] publication. Projections are based on what has happened in the past rather than predicting the impact of events. As such the projections do not take account of COVID-19 or the impact of leaving the EU. The analysis in this chapter is based on the principal projection by NRS, however, other projections based on different assumptions for migration and fertility are also produced. It should be noted that population projections are not revised every year.
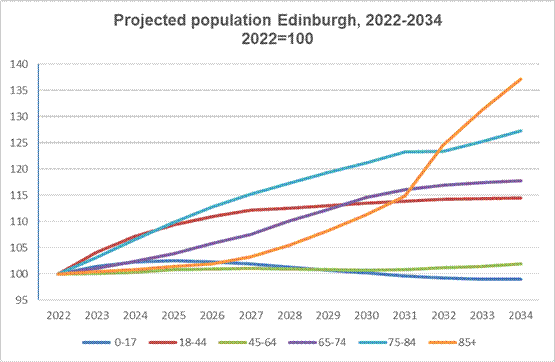
The graph below shows that the age groups with the greatest population growth until 2034 are for those aged 65 and over. The age group showing the largest increase is 85 years and over. The under 18 age group, although showing an increase for a number of years, by 2034 is projected to be smaller than in 2018.
The increasing population in the older people age groups are driving the overall percentage increase in population. The older age groups have increases above the overall increase and the age groups under 65 all have increases below the overall increase, except 18-44.
Chart 1.1: Projected population Edinburgh 2022-2034
Data from Chart 1.1 showing growth from baseline in 2022 for each age group
| Year | 0-17 | 18-44 | 45-64 | 65-74 | 75-84 | 85+ |
| 2022 | 100 | 100 | 100 | 100 | 100 | 100 |
| 2023 | 101.4 | 104.1 | 100.1 | 101.1 | 103.2 | 100.4 |
| 2024 | 102.3 | 107.2 | 100.4 | 102.4 | 106.6 | 100.8 |
| 2025 | 102.6 | 109.4 | 100.9 | 103.8 | 109.9 | 101.5 |
| 2026 | 102.4 | 111.0 | 100.9 | 105.8 | 112.7 | 101.9 |
| 2027 | 101.9 | 112.2 | 101.1 | 107.6 | 115.2 | 103.3 |
| 2028 | 101.3 | 112.6 | 101.0 | 110.1 | 117.3 | 105.4 |
| 2029 | 100.8 | 113.0 | 100.9 | 112.3 | 119.4 | 108.3 |
| 2030 | 100.2 | 113.5 | 100.8 | 114.7 | 121.2 | 111.3 |
| 2031 | 99.6 | 113.9 | 100.9 | 116.1 | 123.2 | 114.8 |
| 2032 | 99.3 | 114.2 | 101.2 | 116.9 | 123.4 | 124.6 |
| 2033 | 99.0 | 114.4 | 101.5 | 117.5 | 125.3 | 131.2 |
| 2034 | 99.0 | 114.5 | 101.9 | 117.8 | 127.3 | 137.1 |
The tables below shows the projection populations by age group and gender from the 2022 base year to 2034.
Table 1.8: Projected population by age and gender 2022-2034
| 2022 | 2023 | 2024 | 2025 | 2026 | 2027 | 2028 | 2029 | 2030 | 2031 | 2032 | 2033 | 2034 | |
| Males | |||||||||||||
| 0-17 | 43,191 | 43,730 | 44,072 | 44,189 | 44,139 | 43,984 | 43,772 | 43,559 | 43,300 | 42,992 | 42,800 | 42,686 | 42,593 |
| 18-44 | 108,986 | 113,011 | 115,841 | 117,853 | 119,353 | 120,526 | 120,932 | 121,424 | 121,958 | 122,473 | 122,792 | 123,036 | 123,249 |
| 45-64 | 59,776 | 59,783 | 59,966 | 60,286 | 60,278 | 60,325 | 60,195 | 60,075 | 59,855 | 59,868 | 59,967 | 60,063 | 60,174 |
| 65-74 | 20,926 | 21,166 | 21,459 | 21,795 | 22,226 | 22,546 | 23,097 | 23,481 | 24,009 | 24,247 | 24,444 | 24,567 | 24,624 |
| 75-84 | 11,716 | 12,195 | 12,673 | 13,070 | 13,468 | 13,822 | 14,084 | 14,363 | 14,563 | 14,874 | 14,911 | 15,154 | 15,446 |
| 85+ | 4,237 | 4,258 | 4,281 | 4,304 | 4,297 | 4,365 | 4,486 | 4,626 | 4,794 | 4,964 | 5,453 | 5,785 | 6,080 |
| Total | 248,832 | 254,143 | 258,292 | 261,497 | 263,761 | 265,568 | 266,566 | 267,528 | 268,479 | 269,418 | 270,367 | 271,291 | 272,166 |
| Females | |||||||||||||
| 0-17 | 40,871 | 41,517 | 41,905 | 42,048 | 41,911 | 41,674 | 41,380 | 41,164 | 40,913 | 40,774 | 40,637 | 40,569 | 40,617 |
| 18-44 | 118,045 | 123,376 | 127,476 | 130,464 | 132,631 | 134,117 | 134,682 | 135,152 | 135,654 | 136,108 | 136,494 | 136,722 | 136,715 |
| 45-64 | 61,226 | 61,369 | 61,535 | 61,755 | 61,858 | 62,025 | 62,019 | 62,012 | 62,096 | 62,219 | 62,458 | 62,719 | 63,149 |
| 65-74 | 22,982 | 23,235 | 23,492 | 23,797 | 24,233 | 24,696 | 25,252 | 25,831 | 26,342 | 26,715 | 26,884 | 27,006 | 27,095 |
| 75-84 | 15,273 | 15,650 | 16,097 | 16,582 | 16,962 | 17,275 | 17,567 | 17,855 | 18,143 | 18,383 | 18,405 | 18,656 | 18,911 |
| 85+ | 7,341 | 7,371 | 7,390 | 7,448 | 7,500 | 7,590 | 7,723 | 7,911 | 8,097 | 8,333 | 8,973 | 9,410 | 9,794 |
| Total | 265,738 | 272,518 | 277,895 | 282,094 | 285,095 | 287,377 | 288,623 | 289,925 | 291,245 | 292,532 | 293,851 | 295,082 | 296,281 |
| All people | |||||||||||||
| 0-17 | 84,062 | 85,247 | 85,977 | 86,237 | 86,050 | 85,658 | 85,152 | 84,723 | 84,213 | 83,766 | 83,437 | 83,255 | 83,210 |
| 18-44 | 227,031 | 236,387 | 243,317 | 248,317 | 251,984 | 254,643 | 255,614 | 256,576 | 257,612 | 258,581 | 259,286 | 259,758 | 259,964 |
| 45-64 | 121,002 | 121,152 | 121,501 | 122,041 | 122,136 | 122,350 | 122,214 | 122,087 | 121,951 | 122,087 | 122,425 | 122,782 | 123,323 |
| 65-74 | 43,908 | 44,401 | 44,951 | 45,592 | 46,459 | 47,242 | 48,349 | 49,312 | 50,351 | 50,962 | 51,328 | 51,573 | 51,719 |
| 75-84 | 26,989 | 27,845 | 28,770 | 29,652 | 30,430 | 31,097 | 31,651 | 32,218 | 32,706 | 33,257 | 33,316 | 33,810 | 34,357 |
| 85+ | 11,578 | 11,629 | 11,671 | 11,752 | 11,797 | 11,955 | 12,209 | 12,537 | 12,891 | 13,297 | 14,426 | 15,195 | 15,874 |
| Total | 514,570 | 526,661 | 536,187 | 543,591 | 548,856 | 552,945 | 555,189 | 557,453 | 559,724 | 561,950 | 564,218 | 566,373 | 568,447 |
Overall the population of Edinburgh is expected to grow by 10.5% over the period from 2022 to 2034, however, this masks the expected change in population for certain age groups.
The overall growth in population is larger in Edinburgh than nationally, however, the distribution of that growth varies substantially when compared against specific age groups.
Table 1.9: Percentage change in population 2022-2034
| Edinburgh | Scotland | |||||
| Males | Females | Total | Males | Females | Total | |
| 0-17 | -1.4% | -0.6% | -1.0% | -8.2% | -8.1% | -8.2% |
| 18-44 | 13.1% | 15.8% | 14.5% | 8.5% | 8.1% | 8.3% |
| 45-64 | 0.7% | 3.1% | 1.9% | -7.0% | -6.0% | -6.5% |
| 65-74 | 17.7% | 17.9% | 17.8% | 19.6% | 22.0% | 20.8% |
| 75-84 | 31.8% | 23.8% | 27.3% | 30.7% | 24.9% | 27.5% |
| 85+ | 43.5% | 33.4% | 37.1% | 56.9% | 38.9% | 45.6% |
| Total | 9.4% | 11.5% | 10.5% | 4.4% | 5.1% | 4.8% |
Table 1.10: Absolute change in population, Edinburgh 2022-2034
| Edinburgh | |||
| Males | Females | Total | |
| 0-17 | -598 | -254 | -852 |
| 18-44 | 14,263 | 18,670 | 32,933 |
| 45-64 | 398 | 1,923 | 2,321 |
| 65-74 | 3,698 | 4,113 | 7,811 |
| 75-84 | 3,730 | 3,638 | 7,368 |
| 85+ | 1,843 | 2,453 | 4,296 |
| Total | 23,334 | 30,543 | 53,877 |
Key points include:
- The under 18 population in Edinburgh is expected to fall slightly, but much less than nationally.
- The adult 18-64 population in Edinburgh is expected to grow by just under the overall population increase of 10.5% (35,254 people, 10.1%), whereas it will only increase 1.67% nationally.
- Each of the older population age groups in Edinburgh and Scotland are expected to grow by around or more than a fifth.
- The 85+ age group is expected to grow more nationally than in Edinburgh.
- The 85+ age group is expected to be the age group with the largest growth across both Edinburgh and Scotland (37.1%, 45.6%)
Looking specifically in greater detail at the expected population increases of the older population by gender the figures are particularly striking. In Edinburgh, the number of men aged 90+ is projected to rise from 1,433 to 1,995 over the period. At 43.5%, this is larger percentage increase than the expected increase in the number of women from 2,870 to 3,845 (33.4%). The increase in those aged over 90 accounts for 35.7% of the growth in the over 85+ population.
Table 1.11: Percentage change in population, 2022-2034
| Edinburgh | Scotland | |||||
| Males | Females | Total | Males | Females | Total | |
| 65+ | 25.1% | 22.4% | 23.6% | 26.9% | 25.3% | 26.0% |
| 90+ | 39.2% | 34.0% | 35.7% | 45.5% | 31.2% | 40.0% |
Table 1.12: Absolute change in population, 2022-2034
| Edinburgh | Scotland | |||||
| Males | Females | Total | Males | Females | Total | |
| 65+ | 9,271 | 10,204 | 19,475 | 134,050 | 151,328 | 285,378 |
| 90+ | 562 | 975 | 1,537 | 6,842 | 9,323 | 16,165 |
[1] Subnational Population Projections: 2022-based, National Records of Scotland https://www.nrscotland.gov.uk/publications/subnational-population-projections-2022-based/#
The Improvement Service and NRS along with the Universities of Manchester and Edinburgh have developed sub Council area population projections[1] using past trends in mortality, fertility, and migration to estimate what the population of areas within Councils might look like. These use the citywide data for the 2022 based population projections but show how the increase in population will be seen in different areas across the city.
Table 1.13: Projected population by age and locality 2022-2034
| North East | |||||||||||||
| 2022 | 2023 | 2024 | 2025 | 2026 | 2027 | 2028 | 2029 | 2030 | 2031 | 2032 | 2033 | 2034 | |
| 0-17 | 17,483 | 17,727 | 17,983 | 18,174 | 18,290 | 18,391 | 18,472 | 18,599 | 18,692 | 18,829 | 19,008 | 19,204 | 19,423 |
| 18-44 | 58,476 | 61,452 | 63,714 | 65,532 | 67,007 | 68,226 | 69,114 | 69,955 | 70,761 | 71,408 | 72,027 | 72,487 | 72,899 |
| 45-64 | 27,724 | 27,838 | 28,053 | 28,369 | 28,574 | 28,842 | 28,952 | 29,151 | 29,307 | 29,694 | 30,100 | 30,590 | 31,100 |
| 65-74 | 8,803 | 8,988 | 9,218 | 9,456 | 9,699 | 9,948 | 10,298 | 10,512 | 10,845 | 11,036 | 11,177 | 11,281 | 11,360 |
| 75-84 | 5,180 | 5,327 | 5,496 | 5,579 | 5,712 | 5,811 | 5,926 | 6,070 | 6,194 | 6,332 | 6,371 | 6,541 | 6,732 |
| 85+ | 2,172 | 2,114 | 2,045 | 2,021 | 2,013 | 2,005 | 2,020 | 2,052 | 2,090 | 2,146 | 2,318 | 2,440 | 2,535 |
| Total | 119,838 | 123,446 | 126,509 | 129,131 | 131,295 | 133,223 | 134,782 | 136,339 | 137,889 | 139,445 | 141,001 | 142,543 | 144,049 |
| North West | |||||||||||||
| 2022 | 2023 | 2024 | 2025 | 2026 | 2027 | 2028 | 2029 | 2030 | 2031 | 2032 | 2033 | 2034 | |
| 0-17 | 28,915 | 28,915 | 28,800 | 28,647 | 28,381 | 28,066 | 27,710 | 27,331 | 26,920 | 26,517 | 26,160 | 25,875 | 25,627 |
| 18-44 | 50,799 | 52,661 | 54,063 | 54,888 | 55,421 | 55,728 | 55,682 | 55,727 | 55,768 | 55,823 | 55,859 | 55,789 | 55,661 |
| 45-64 | 38,957 | 38,927 | 38,857 | 38,878 | 38,811 | 38,757 | 38,569 | 38,333 | 38,170 | 38,088 | 37,968 | 37,905 | 37,856 |
| 65-74 | 14,302 | 14,485 | 14,718 | 14,998 | 15,294 | 15,610 | 16,017 | 16,381 | 16,717 | 16,826 | 16,938 | 16,955 | 16,920 |
| 75-84 | 9,155 | 9,376 | 9,631 | 9,912 | 10,180 | 10,368 | 10,525 | 10,701 | 10,866 | 11,094 | 11,092 | 11,265 | 11,489 |
| 85+ | 4,114 | 4,171 | 4,243 | 4,295 | 4,314 | 4,390 | 4,507 | 4,615 | 4,715 | 4,846 | 5,233 | 5,477 | 5,699 |
| Total | 146,242 | 148,535 | 150,312 | 151,618 | 152,401 | 152,919 | 153,010 | 153,088 | 153,156 | 153,194 | 153,250 | 153,266 | 153,252 |
| South East | |||||||||||||
| 2022 | 2023 | 2024 | 2025 | 2026 | 2027 | 2028 | 2029 | 2030 | 2031 | 2032 | 2033 | 2034 | |
| 0-17 | 18,400 | 19,137 | 19,656 | 19,893 | 19,947 | 19,901 | 19,887 | 19,928 | 20,003 | 20,046 | 20,091 | 20,200 | 20,333 |
| 18-44 | 70,227 | 73,076 | 75,157 | 76,715 | 77,908 | 78,761 | 78,963 | 79,142 | 79,397 | 79,634 | 79,797 | 79,925 | 79,968 |
| 45-64 | 27,865 | 27,922 | 28,036 | 28,179 | 28,155 | 28,157 | 28,116 | 28,058 | 27,948 | 27,873 | 27,910 | 27,917 | 27,994 |
| 65-74 | 10,841 | 10,952 | 11,031 | 11,075 | 11,212 | 11,412 | 11,568 | 11,765 | 11,983 | 12,146 | 12,233 | 12,305 | 12,379 |
| 75-84 | 6,417 | 6,696 | 6,989 | 7,321 | 7,591 | 7,772 | 8,000 | 8,192 | 8,290 | 8,450 | 8,497 | 8,605 | 8,692 |
| 85+ | 2,819 | 2,808 | 2,816 | 2,838 | 2,851 | 2,894 | 2,964 | 3,058 | 3,194 | 3,313 | 3,607 | 3,821 | 4,017 |
| Total | 136,569 | 140,591 | 143,685 | 146,021 | 147,664 | 148,897 | 149,498 | 150,143 | 150,815 | 151,462 | 152,135 | 152,773 | 153,383 |
| South West | |||||||||||||
| 2022 | 2023 | 2024 | 2025 | 2026 | 2027 | 2028 | 2029 | 2030 | 2031 | 2032 | 2033 | 2034 | |
| 0-17 | 19,264 | 19,466 | 19,538 | 19,526 | 19,432 | 19,297 | 19,072 | 18,856 | 18,606 | 18,377 | 18,184 | 17,979 | 17,823 |
| 18-44 | 47,529 | 49,191 | 50,383 | 51,185 | 51,653 | 51,917 | 51,849 | 51,752 | 51,693 | 51,719 | 51,610 | 51,567 | 51,439 |
| 45-64 | 26,456 | 26,462 | 26,559 | 26,619 | 26,598 | 26,596 | 26,576 | 26,545 | 26,530 | 26,427 | 26,446 | 26,370 | 26,372 |
| 65-74 | 9,962 | 9,975 | 9,982 | 10,063 | 10,249 | 10,270 | 10,465 | 10,659 | 10,806 | 10,956 | 10,985 | 11,031 | 11,064 |
| 75-84 | 6,237 | 6,442 | 6,652 | 6,840 | 6,946 | 7,147 | 7,206 | 7,256 | 7,353 | 7,375 | 7,349 | 7,395 | 7,441 |
| 85+ | 2,473 | 2,531 | 2,570 | 2,597 | 2,620 | 2,665 | 2,716 | 2,813 | 2,886 | 2,998 | 3,267 | 3,461 | 3,623 |
| Total | 111,921 | 114,067 | 115,684 | 116,830 | 117,498 | 117,892 | 117,884 | 117,881 | 117,874 | 117,852 | 117,841 | 117,803 | 117,762 |
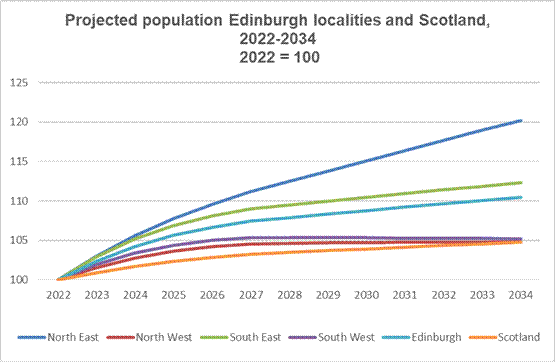
The percentage change in population by age group and locality is shown in the table and graph below. Edinburgh and Scotland population changes are shown for comparison.
Table 1.14: Percentage change in population 2022-2034
| North East | North West | South East | South West | Edinburgh | Scotland | |
| 0-17 | 11.1% | -11.4% | 10.5% | -7.5% | -1.0% | -8.2% |
| 18-44 | 24.7% | 9.6% | 13.9% | 8.2% | 14.5% | 8.3% |
| 45-64 | 12.2% | -2.8% | 0.5% | -0.3% | 1.9% | -6.5% |
| 65-74 | 29.0% | 18.3% | 14.2% | 11.1% | 17.8% | 20.8% |
| 75-84 | 30.0% | 25.5% | 35.5% | 19.3% | 27.3% | 27.5% |
| 85+ | 16.7% | 38.5% | 42.5% | 46.5% | 37.1% | 45.6% |
| Total | 20.2% | 4.8% | 12.3% | 5.2% | 10.5% | 4.8% |
| 65+ | 27.7% | 23.7% | 25.0% | 18.5% | 23.6% | 26.0% |
| 90+ | 2.9% | 47.1% | 32.0% | 50.2% | 35.7% | 40.0% |
Key points include:
- The under 18 population grows in the east of the city whereas it decreases in the west.
- The largest growth is in the North East of Edinburgh. The percentage growth for adults aged 45-64 is twenty-four times as high in North East as in South East.
- The largest growth for older people aged 65+ is in North East (27.7%) and the largest growth for older people aged 90+ is in South West (50.2%).
Chart 1.2: Projected population Edinburgh localities, 2022-2034
Data from Chart 1.2 showing growth from baseline in 2022 for locality
| Year | North East | North West | South East | South West | Edinburgh | Scotland |
| 2022 | 100 | 100 | 100 | 100 | 100 | 100 |
| 2023 | 103.0 | 101.6 | 102.9 | 102.0 | 102.3 | 100.9 |
| 2024 | 105.6 | 102.8 | 105.2 | 103.4 | 104.2 | 101.7 |
| 2025 | 107.8 | 103.7 | 106.9 | 104.4 | 105.6 | 102.3 |
| 2026 | 109.6 | 104.2 | 108.1 | 104.9 | 106.7 | 102.8 |
| 2027 | 111.2 | 104.6 | 109.0 | 105.4 | 107.5 | 103.2 |
| 2028 | 112.5 | 104.6 | 109.5 | 105.3 | 107.9 | 103.5 |
| 2029 | 113.8 | 104.7 | 109.9 | 105.3 | 108.3 | 103.7 |
| 2030 | 115.1 | 104.7 | 110.4 | 105.3 | 108.8 | 103.9 |
| 2031 | 116.4 | 104.8 | 110.9 | 105.3 | 109.2 | 104.1 |
| 2032 | 117.7 | 104.8 | 111.4 | 105.3 | 109.6 | 104.4 |
| 2033 | 118.9 | 104.8 | 111.9 | 105.3 | 110.1 | 104.6 |
| 2034 | 120.2 | 104.8 | 112.3 | 105.2 | 110.5 | 104.8 |
Migration
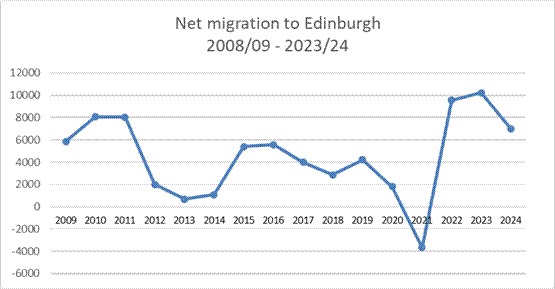
An element of understanding the growth in population is understanding how migration is driving that change. Different groups of people will come to, and leave, Edinburgh at different stages in life. The NRS Total Migration to or from Scotland[i] publication shows that over the last ten years, the average net migration to Edinburgh has been 4270 people per year. This average figure has increased by 43.3%, compared to the previous figure from 2021/2022. It is very likely that covid impacted the migration figures in 2021, where there is a negative net migration.
Chart 1.3: Net migration to Edinburgh 2008/09-2023/24
Data from Chart 1.3 showing net migration to Edinburgh by year
| Year | Net Migration to Edinburgh |
| 2009 | 5,860 |
| 2010 | 8,070 |
| 2011 | 8,040 |
| 2012 | 2,010 |
| 2013 | 670 |
| 2014 | 1,080 |
| 2015 | 5,380 |
| 2016 | 5,560 |
| 2017 | 3,970 |
| 2018 | 2,850 |
| 2019 | 4,210 |
| 2020 | 1,790 |
| 2021 | -3,680 |
| 2022 | 9,570 |
| 2023 | 10,220 |
| 2024 | 6,970 |
The table below compares the number of people moving to Edinburgh from other areas of Scotland, other areas of the UK and overseas. The overall numbers moving from elsewhere in the UK or overseas for Scotland are given for context.
Table 1.15: Net migration 2023/24
| Total | Within Scotland | Rest of UK | Overseas | |
| Edinburgh | 6,970 | -3,350 | 2,400 | 7,920 |
| Scotland | 56,400 | NA | 13,800 | 42,600 |
The table above shows that more people leave Edinburgh to live elsewhere in Scotland than move from elsewhere in Scotland to live in Edinburgh (-3,350). It also shows that 17% of net migration from the rest of the UK to Scotland is to Edinburgh (2,400 out of 13,800) and that 26% of net overseas migration to Scotland is to Edinburgh (7,920 out of 42,600). The impact of leaving the EU on migration also needs taken into account when considering future population flows. The Expert Advisory Group on Migration and Population in their July 2020 update[ii] continued to hold to their original February 2019 projections, following publication of the UK Government’s February 2020 policy statement on the points-based immigration system9, that net overseas migration to Scotland will fall by between 30% and 50%.
The net migration figures hide the high numbers of people arriving and leaving. This is important when it comes to ensuring that services have capacity to cope, not only with volume of service provision, but in relation to the turnover of service users.
Table 1.16: Migration flows, Edinburgh 2023/24
| Within Scotland | Rest of UK | Overseas | Total | |
| In | 10,900 | 9,920 | 19,090 | 39,910 |
| Out | 14,250 | 7,520 | 11,170 | 32,940 |
| Net total | -3,350 | 2,400 | 7,920 | 6,970 |
| Total individuals migrating | 25,150 | 17,440 | 30,260 | 72,850 |
The net migration of 6,970 (1.3% of the 2024 estimated population) masks that there were 72,850 (13.7%) either arriving or leaving Edinburgh in 2023/24. The net migration has increased in 2024 (6,970) compared to 2019 (5,910), this is a representation of a 23% increase of total individuals migrating (from 59,140 in 2019 to 72,850 in 2024).
International migration estimates for the year ending June 2021 are using a different method to those previously published. They rely less on IPS data and make greater use of administrative data. This means that the latest figures on international migration may not be comparable with previous estimates produced from the IPS or more recently using some statistical modelling (for the year ending June 2020).
[i] Migration flows, mid-2024, National Records of Scotland https://www.nrscotland.gov.uk/publications/migration-flows-mid-2024/ (14 August 2025)
[ii] UK Immigration Policy After Leaving the EU – Impacts on Scotland’s Economy, Population and Society – July 2020 update, Expert Advisory Group on Population and Migration https://www.gov.scot/binaries/content/documents/govscot/publications/independent-report/2020/07/uk-immigration-policy-leaving-eu-impacts-scotlands-economy-population-society-july-2020-update/documents/uk-immigration-policy-leaving-eu-impacts-scotlands-economy-population-society-july-2020-update/uk-immigration-policy-leaving-eu-impacts-scotlands-economy-population-society-july-2020-update/govscot%3Adocument/uk-immigration-policy-leaving-eu-impacts-scotlands-economy-population-society-july-2020-update.pdf (July 2020)
9 The UK’s points-based immigration system: policy statement, Home Office https://www.gov.uk/government/publications/the-uks-points-based-immigration-system-policy-statement/the-uks-points-based-immigration-system-policy-statement (19 February 2020)
The Scottish Index of Multiple Deprivation (SIMD)[i] provides a relative measure of deprivation across Scotland. The country is split into 6,976 small areas called datazones and deprivation is identified across seven, differently weighted, domains: income, employment, education, health, access to services, crime and housing. Each datazone is then ranked into order from least to most deprived. It is important to remember that as it is a relative measure it is not possible to say that one datazone is twice as deprived as another.
There are 597 datazones in Edinburgh. The mean population of the datazones in Edinburgh is 860 (ranging from 258 (an area in Oxgangs) to 3,847 (including the Riccarton campus of Heriot-Watt University) and a median of 836). By ranking all datazones in Scotland from most deprived to least deprived it is possible to see what proportion of the population in Edinburgh live in the 20% most deprived areas of the country, as well as the other quintiles to the 20% least deprived.
The table below shows the proportion of population (2017 based NRS small area population estimates – these are the latest used in the Scottish Government SIMD analysis) in each locality living in each deprivation quintile
Table 1.17: Percentage of population in deprivation quintile by locality
| North East | North West | South East | South West | Edinburgh | Scotland | |
| 1 (Most deprived) | 16.5% | 9.0% | 9.4% | 12.6% | 11.6% | 19.5% |
| 2 | 19.1% | 11.1% | 13.3% | 13.8% | 14.1% | 19.5% |
| 3 | 18.7% | 9.2% | 13.5% | 16.2% | 14.1% | 19.8% |
| 4 | 21.2% | 17.6% | 13.1% | 15.4% | 16.7% | 20.5% |
| 5 (Least deprived) | 24.6% | 53.1% | 50.7% | 42.1% | 43.5% | 20.7% |
| Grand Total | 100.0% | 100.0% | 100.0% | 100.0% | 100.0% | 100.0% |
Key points include:
- Over half of the population in both North West and South East live in the 20% least deprived datazones in Scotland.
- North East has the highest proportions living in the most deprived datazones.
- In North West almost six times as many people live in the 20% least deprived datazones as in the most deprived datazones whereas, in North East only 1.5 times as many people live in the 20% least deprived datazones as in the most deprived datazones.
- Just slightly more than 1 in 9 people (11.6%) in Edinburgh live in the 20% most deprived areas of Scotland.
- Just over 2 in 5 people (43.5%) in Edinburgh live in the 20% least deprived areas of Scotland.
- Across Scotland, as expected, a fifth of the population live in each deprivation quintile.
A more detailed briefing note on SIMD was prepared by Strategy and Communications for Elected Members of the City of Edinburgh Council. The briefing includes ward profiles and is included as appendix 1.
The report highlights:
- Edinburgh’s share of the most deprived areas in Scotland has decreased since the last SIMD in 2016. Of the 20% most deprived data zones in Scotland, 5.0% are in Edinburgh, compared to 5.9% in SIMD 2016.
- In 2020, Edinburgh is the local authority with the seventh highest proportion of data zones in the 20% most deprived areas.
- Whilst deprivation exists in Edinburgh, most of the City’s data zones rank amongst the least deprived areas in Scotland. 45.2% of Edinburgh’s data zones are in the 20% least deprived areas of Scotland. This is similar to the pattern observed for SIMD 2016 when 42% of Edinburgh’s data zones were in the 20% least deprived.
[i] Scottish Index of Multiple Deprivation 2020, Scottish Government https://www.gov.scot/publications/scottish-index-multiple-deprivation-2020/ (28 January 2020)
The NRS Households and Dwellings in Scotland, 2024 [i] publication details that there were estimated to be 244,791 households and 266,309 dwellings in Edinburgh, including 1,430 second homes. There were 6,442 vacant dwellings in Edinburgh, of which 3,093 are long term empty homes. A household means a group of people living together in a dwelling, whether they are alone, or living with others whether related or not. The average household size was 1.96. This average is based on removing people living in communal establishments and student halls of residence.
Of the 244,791 households, nearly two fifths (38.9%; 95,178) were estimated to be single person households. Of the single person households, three in ten (32.7%; 31,129) were older people aged 65+. This is double the overall proportion of the population that is aged 65+ of 16.1%.
Projections for the number of households, as for population, are produced by NRS. The NRS Household projections (2022-based)[ii] publication provides detail on a number of household types. These are summarised in the table below.
Table 1.18: Projections of household by household type, Edinburgh 2022-2034
| 2022 | 2023 | 2024 | 2025 | 2026 | 2027 | 2028 | 2029 | 2030 | 2031 | 2032 | 2033 | 2034 | |
| 1 person female | 49,880 | 50,330 | 50,905 | 51,695 | 52,349 | 53,042 | 53,620 | 54,162 | 54,665 | 55,148 | 55,691 | 56,207 | 56,695 |
| 1 person male | 43,319 | 43,759 | 44,273 | 44,938 | 45,453 | 45,927 | 46,303 | 46,646 | 46,956 | 47,256 | 47,574 | 47,880 | 48,161 |
| 1 adult, 1+ child(ren) | 10,060 | 10,202 | 10,365 | 10,559 | 10,705 | 10,847 | 10,966 | 11,075 | 11,165 | 11,250 | 11,342 | 11,437 | 11,517 |
| 2 person all adult | 77,267 | 78,264 | 79,359 | 80,699 | 81,738 | 82,653 | 83,397 | 84,008 | 84,542 | 85,051 | 85,527 | 85,989 | 86,375 |
| 2+ adults, 1+ child(ren) | 40,497 | 40,707 | 41,043 | 41,540 | 41,963 | 42,390 | 42,775 | 43,222 | 43,631 | 44,035 | 44,483 | 44,965 | 45,438 |
| 3+ person all adults | 18,609 | 18,759 | 18,846 | 18,952 | 19,048 | 19,092 | 19,077 | 19,089 | 19,135 | 19,170 | 19,206 | 19,217 | 19,245 |
| All households | 239,632 | 242,021 | 244,791 | 248,383 | 251,256 | 253,951 | 256,138 | 258,202 | 260,094 | 261,910 | 263,823 | 265,695 | 267,431 |
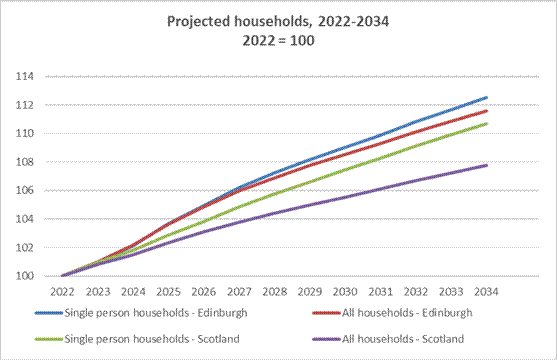
The graph below shows that the increase in single person households exceeds the growth in all households, both in Edinburgh and nationally.
Chart 1.4: Projected households Edinburgh and Scotland 2022-2034
Data from Chart 1.4 showing growth from baseline in 2022 for locality
| Year | Single person Households Edinburgh | Single person Households Scotland | All Households Edinburgh | All Households Scotland |
| 2022 | 100.0 | 100.0 | 100.0 | 100.0 |
| 2023 | 101.0 | 100.9 | 101.0 | 100.8 |
| 2024 | 102.1 | 101.8 | 102.2 | 101.5 |
| 2025 | 103.7 | 102.9 | 103.7 | 102.3 |
| 2026 | 104.9 | 103.8 | 104.9 | 103.1 |
| 2027 | 106.2 | 104.8 | 106.0 | 103.8 |
| 2028 | 107.2 | 105.8 | 106.9 | 104.4 |
| 2029 | 108.2 | 106.6 | 107.7 | 105.0 |
| 2030 | 109.0 | 107.4 | 108.5 | 105.5 |
| 2031 | 109.9 | 108.3 | 109.3 | 106.1 |
| 2032 | 110.8 | 109.1 | 110.1 | 106.7 |
| 2033 | 111.7 | 109.9 | 110.9 | 107.2 |
| 2034 | 112.5 | 110.7 | 111.6 | 107.8 |
In Edinburgh, in comparison with the 10.5% increase in population expected over the period 2022-2034, the anticipated increase in the overall number of households is expected to be 11.6%; single person households are expected to increase by 12.5%. This will result in a decreasing average household size. Without the modification to remove people living in communal establishments and student halls of residence, the average household size will decline from 2.15 to 2.13 over the period. As the assumptions underpinning the amended calculation of household to take into account communal establishments and student halls of residence may change as time progresses (due to changes in the way care is provided or changes in Higher Education) and these have not been declared by NRS, it is not possible to determine the projected average household size.
In Scotland there is projected to be 4.8% increase in the population coupled with a 7.8% increase in the number of households. The number of single person households is expected to increase by 10.7%. The average household size across Scotland, as calculated in the same way above, also decreases from 2.17 to 2.11 between 2022 and 2034.
Key points include:
- The number of households in Edinburgh is expected to increase by 11.6% between 2022 and 2034.
- Nearly two fifths (38.9%) of households in Edinburgh are single person households compared with 37.2% nationally.
- The proportion of single person households is expected to increase slightly to 39.2% by 2034 in Edinburgh and 38.1% nationally.
[i] Estimates of Households and Dwellings in Scotland, 2024, National Records of Scotland https://www.nrscotland.gov.uk/publications/households-and-dwellings-in-scotland-2024/ (26 June 2025)
[ii] Household Projections for Scotland, 2022-based, National Records of Scotland https://www.nrscotland.gov.uk/publications/household-projections-for-scotland-2022-based/ (16 December 2025))